Overview
What is SolarWinds Database Performance Analyzer?
SolarWinds Database Performance Analyzer (DPA) enables deep visibility into database performance and expert advice for performance optimization and tuning.What can you monitor with DPA? OracleOracle ExadataOracle EBSMicrosoft SQL Server Azure SQL DatabaseAzure SQL Database Managed InstanceMySQLDB2 SAP ASE AuroraMariaDBDPA monitors…
Easy to use and provides more details on the queries
DPA Delivers Tremendous Value
Hands Down: SolarWinds Database Performance Analyzer Beats SQL Profile and Database Engine Tuning Advisor
SolarWinds Database Performance Analyzer is a great addition to your DBA and Development toolkit
SolarWinds DPA - covers all/most of your SQL monitoring needs
Top of Class Database Performance Monitoring and Tuning Advisor!
SolarWinds Database Performance Analyzer - Recommended
DPA is hell lot of a Business for Database world
SolarWinds DPA should be on every DBA's wishlist.
SolarWinds DPA is a constant companion making sense of database performance
Awesome Tool for SQL Performance Tuning
SolarWinds DPA is a great product to visually see the health of the databases and make a proactive monitoring and root cause analysis
DPA: FTW.
SolarWinds DPA saves the day every time
SolarWinds Database Performanc Analyzer - DPA Saves The Day!
Awards
Products that are considered exceptional by their customers based on a variety of criteria win TrustRadius awards. Learn more about the types of TrustRadius awards to make the best purchase decision. More about TrustRadius Awards
Reviewer Pros & Cons
Pricing
What is SolarWinds Database Performance Analyzer?
SolarWinds Database Performance Analyzer (DPA) enables deep visibility into database performance and expert advice for performance optimization and tuning. What can you monitor with DPA? Oracle Oracle Exadata Oracle EBS Microsoft…
Entry-level set up fee?
- Setup fee optional
Offerings
- Free Trial
- Free/Freemium Version
- Premium Consulting/Integration Services
Would you like us to let the vendor know that you want pricing?
28 people also want pricing
Alternatives Pricing
What is SolarWinds SQL Sentry?
SolarWinds SQL Sentry is designed to help data professionals optimize SQL Server database performance in physical, virtual, and cloud environments. SQL Sentry delivers metrics to help users find and fix database performance problems and provides scalability, boasting demonstrated success monitoring…
What is dbForge Studio (Edge)?
dbForge Studio is provided by Devart and is a universal front-end client for database management, administration and development. Devart's GUI tool provides utilities to compare, synchronize, and back up databases (e.g. MySQL, Oracle, SQL Server, PostgreSQL, etc.) with scheduling, and includes the…
Product Details
- About
- Integrations
- Competitors
- Tech Details
- Downloadables
- FAQs
What is SolarWinds Database Performance Analyzer?
- Oracle
- Oracle Exadata
- Oracle EBS
- Microsoft SQL Server
- Azure SQL Database
- Azure SQL Database Managed Instance
- MySQL
- DB2
- SAP ASE
- Aurora
- MariaDB
What makes DPA stand out:
- Quick, easy, and reliable performance
troubleshooting available in real time and historically
- Machine learning anomaly analysis to bring intelligence to go beyond traditional threshold based analysis
- Find inefficient workloads, aggregated by table, for indexing opportunities—an “X marks the spot” tuning analysis
- Cross-platform database support for a single-pane-of-glass view into your environment
- Blocking analysis: what is blocking and a hierarchy of what is being blocked, plus overall impact
- PerfStack™ integration with other SolarWinds products for more complete visibility (applications, servers, storage, hypervisor, network, and more)
- Agent-less architecture with the ability to scale from a few instances to thousands, low 1% average overhead
SolarWinds Database Performance Analyzer Features
- Supported: Database monitoring
- Supported: Tuning advisors for queries, workload, and indexes aggregated at the table level
- Supported: Correlated resource metrics for easy diagnosis of hardware constraint impacts on end-users
- Supported: Detailed blocking analysis for contention bottlenecks
- Supported: I/O activity tracking at the drive/mount and file level
- Supported: Alerts and reports
- Supported: DPA Central to manage large and/or distributed environments
- Supported: Always On Availability Group and RAC insights
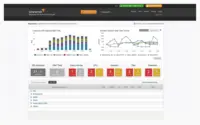
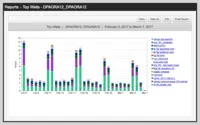
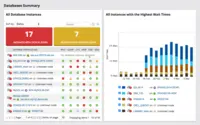
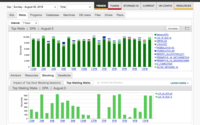
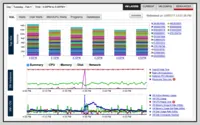
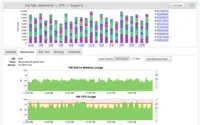
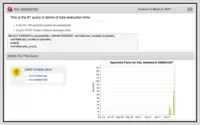
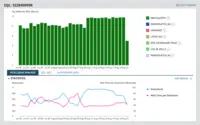
SolarWinds Database Performance Analyzer Screenshots
SolarWinds Database Performance Analyzer Videos
Watch Product Overview
SolarWinds Database Performance Analyzer Integrations
- SolarWinds Server & Application Monitor
- SolarWinds Virtualization Manager (VMAN)
- SolarWinds Storage Resource Monitor (SRM)
- SolarWinds Network Performance Monitor (NPM)
- SolarWinds NetFlow Traffic Analyzer (NTA)
- SolarWinds Network Configuration Manager (NCM)
- SolarWinds IP Address Manager (IPAM)
- SolarWinds VoIP & Network Quality Manager (VNQM)
- SolarWinds Web Performance Monitor (WPM)
- SolarWinds User Device Tracker
SolarWinds Database Performance Analyzer Competitors
SolarWinds Database Performance Analyzer Technical Details
| Deployment Types | On-premise, Software as a Service (SaaS), Cloud, or Web-Based |
|---|---|
| Operating Systems | Windows, AWS Marketplace app |
| Mobile Application | No |
SolarWinds Database Performance Analyzer Downloadables
Frequently Asked Questions
Comparisons
Compare with
Reviews and Ratings
(227)Community Insights
- Pros
- Cons
- Recommendations
User-Friendly Interface: Users appreciate the SolarWinds Database Performance Analyzer for its straightforward and easy-to-understand interface. They find it intuitive and user-friendly, even for new users with minimal training.
Real-Time Analysis and Support: The tool's real-time analysis capabilities and support services are highly valued by users. They mention that it helps them promptly identify and resolve performance issues in SQL databases, such as errors, long-running queries, or system-blocking problems.
Wide Range of Supported Databases: Users find the extensive range of supported databases to be a valuable feature of the tool. It allows them to monitor and analyze the performance of multiple databases from one centralized interface.
Dated and Confusing User Interface: Several users have expressed frustration with the user interface, describing it as dated, confusing, and difficult to navigate. They suggest that the user interface could be more user-friendly and have a reduced learning curve. Some users also mentioned that the navigation can be unintuitive and sometimes tough, and that some items can be confusing to find again. Overall, improvements in the cosmetic aspects of the user interface are needed.
Lack of Reporting Flexibility: According to some users, there is a lack of flexibility in both dashboard customization and reporting capabilities. They feel that the reporting feature needs improvement to provide more options for customization and analysis. This limitation hinders users' ability to obtain meaningful insights from their data.
High Cost: The cost of the software has been a major complaint among some users, particularly when it comes to adding additional instances. These users mention that the licensing timeline needs improvement as adding new instances becomes cost-prohibitive during certain periods of the year. The high cost associated with using this software can limit its accessibility for businesses operating on tight budgets.
Users highly recommend trying the free trial and evaluating SolarWinds DPA before purchasing. They suggest taking advantage of the free demo and training resources provided by SolarWinds. Users advise implementing SolarWinds DPA for monitoring and analyzing databases, especially for those who are just learning. The software is also recommended for DBAs in small to medium businesses and for integrating with other SolarWinds products for better data analysis. Additionally, users suggest comparing it with Idera offerings for SQL performance monitoring and highlighting it to DBAs as they will likely find value in it.
Attribute Ratings
- 8.6Likelihood to Renew4 ratings
- 9.1Availability1 rating
- 9.1Performance1 rating
- 9Usability6 ratings
- 9.3Support Rating6 ratings
- 7.3Implementation Rating2 ratings
- 7.3Configurability1 rating
- 8.2Product Scalability1 rating
- 8.2Ease of integration1 rating
- 9.1Vendor pre-sale1 rating
- 9.1Vendor post-sale1 rating
- 10Solarwinds Premier Support Rating10 ratings
- 7.3SolarWinds Smart Start Support Rating1 rating
Reviews
(1-25 of 48)- Database performance monitoring.
- Database performance root cause analysis.
- Server performance monitoring.
- Licensing Model can be expensive on a per-instance basis, consider a per-host-based option.
- Limited ability to combine monitoring results for similar groups of servers.
- Different license types for different types of servers (Oracle Enterprise vs Standard).
SolarWinds Database Performance Analyzer - Recommended
- Automatically emails me weekly reports so I can keep an eye on our database performance.
- Easily identify problem queries.
- Helps us optimized our code.
- The initial learning curve is a little steep.
- A better explanation of the features would be nice.
- Navigation is sometimes a little tough.
SolarWinds DPA should be on every DBA's wishlist.
- The alert configuration is very robust, allowing simple OOTB alerts as well as complex query-based alerts.
- Blocking event tracking makes it easy to identify if a user's performance issue is a truly server-related performance problem.
- Historical tracking of queries allows me to easily identify frequently used statements that might need tuning.
- Some of the navigation leads to points that cannot be easily backed out of.
- Some navigation points lead around in circles.
- I would like to see index usage statistics as well as fragmentation.
- The product is great at visualizing the data you need for administration and performance tuning, making it understandable in seconds. A database like Oracle has AWR reports - many pages long, all text, hard to read. SQL Server has dynamic management views - good stuff but not so easily accessible. SolarWinds Database Performance Analyzer (DPA) lays it out so it is quickly comprehensible and actionable.
- DPA tells us what's really going on. Example: the developer says this stored procedure is running super slowly in this RDBMS but runs like lightning on this other one. They've tried to tune it to no avail. So we spend just a few minutes with DPA investigating the situation and we find that the stored proc is running fine. Instead, it is the application's attempt to access the metadata about the proc that is slow. This led to caching the metadata and now the 'slow' proc is running great! Without DPA it would have been a long time before we got to looking at the right code to tweak.
- It's great that we can use the built-in alerts functionality to create custom alerts. The custom alerts can gather information for the databases we are monitoring or from the data DPA collects which go beyond the database and into other relevant pieces like the OS, storage and the network.
- It's a great product - they do most things right. Maybe I'll say keep working on the UI so I can get to the info I need with even fewer clicks.
- One feature a competitor of DPA has that looks useful is mapping out when jobs are run and being able to map that time-wise against when problems occur.
Awesome Tool for SQL Performance Tuning
- Tells you which statements in which stored procedures need work or are catastrophic (if that applies).
- Helps you focus attention on what really needs work, very efficiently.
- The UI gets clunky if you have lots of servers to monitor.
- It doesn't really rank problems across multiple servers.
SolarWinds DPA saves the day every time
- Analyzing query performance
- Index recommendation
- Wait time categorization and explanation
- Navigation is generally good, but some items can be confusing to find again
SolarWinds Database Performanc Analyzer - DPA Saves The Day!
- Great Visual Display from Console - at a glance you can tell if there are issues
- Drill down on a single query to get recommendations on tuning the statement
- Automated Notifications, which can be customized / modified
- Live view on Storage I/O
- Resource Monitor is a plus - CPU Utilization - Instance and OS
- Recently addressed - protect the supply chain
- I can't keep up with all the improvements to tell you the truth ... Database Performance Analyzer is Awesome
- Demo Database Performance Analyzer - you will not be let down
- Join THWACK so you get the most out of your product. Great forum to get answers from colleges that may be experiencing the same issue!
Great Database Performance Analyzing and Monitoring Tool
- Anomaly Detection.
- Optimizing Database Performance.
- Tuning Advisors and Query Wait Time Improvements.
- Integration with Orion Platform.
- Product Cost is High.
- Anomaly Detection is only available for certain Database attributes (Wait Time).
- Excellent for trending SQL Performance over time.
- Excellent for monitoring deadlocks and blocking.
- Good for trending SQL query changes over time.
- It would be nice to have more built-in alerting capabilities.
- Indexing recommendations are also somewhat unclear. I have seen areas that say you could improve performance on a table for example but not giving any additional details beyond that.
- More in-depth recommendations, other tools like Idera Diagnostic Manager I feel are stronger in this area.
Alerting and notifications are not as strong as some other tools I have used.
Blocking and deadlocking features/analysis could be improved also.
Faster resolution in the blink of an eye
We're also setting up alerts as per the requirement.
- Tuning
- Deadlock issues
- Blocking
- Alerts
- Reports
- Performance tuning
- Graphical representation of SQL agent jobs
- Easy to create any graphs by adding tables or columns
- Change the home page for more options
- Best possible recommendations
SolarWinds Database Performance Analyzer solves problems that OEM can't even recognize are occurring
- Maintains historical SQL execution data, enabling forensic analysis
- Has the ability to slice and dice the data so that you can drill down to the execution of a single SQL statement being executed by a stored procedure
- Alerts to when the consumption pattern changes
- Shows historical average run times against the current, illustrating problems when they arise
- Provides tuning advice based on best practices
- Everything is displayed visually, if you need detailed metrics, you have to extract manually, it could use a report writer with export to Excel.
- When a SQL statement is very long running, i.e. longer than the display interval, the display says that there are no statistics, it should on the other hand, show that the SQL statement is still running.
- When you name a SQL statement, it should be by DB, rather than global
Very appropriate for alerting to performance issues before they become critical
Can be challenging when monitoring an Oracle active-active RAC database, as each instance is effectively a separate database.
Database Performance Analyzer - A Good Overall Monitoring and Trending Tool for Database Metrics
- Speed
- Ease of Use
- Appearance
- Detail
- Setting up alerts and blackouts could use improvement
- Should be able to flip between SQL ID and hash plan for queries
- Some queries that run on the database instances themselves could use tuning
Solarwinds DPA - a DBA's MVP!
- Insight into query wait times
- Ability to view Disk IO
- Historical trending of wait times
- Dated UI
- Development servers are not free
- Dashboard visualization of stats requires Solarwinds Performance Monitor (Included with Orion)
One thing to note is that you will need to host DPA yourself, it's not a cloud solution (although you can host it in the cloud if you prefer). This also means you have complete control over where this data resides.
Great for general monitoring
- Displaying baselines helps to show management how a change has affected performance positively or negatively.
- The tuning feature is helpful in showing areas that could be improved with an index or code updates.
- Wait statistics information is very helpful to diagnose database bottlenecks.
- Naming the hash takes more steps then it did in the past.
- It would be nice if there was a way to group the wait statistics by procedure.
- I search feature would be helpful.
DPA Pros and Cons
- Query Analyzer
- HA Status
- DAG HA Analyzer
- Custom Time Windows for history
DPA in Govenment
- Peoplesoft DBs: we often use it to recommend indexes or find queries that need tuning.
- Availability group monitors and alerts so we know when there are problems.
- Trends over time: like blocking, deadlocks or stuck queries DPA helps pinpoint the cause.
- Bug with fantom availability group.
- Analyzes performance trends with all of the databases
- Analyzes memory, CPU, and disk space on the SQL servers and alerts on any potential issues
- Provides stats on wait times by database
- Offers tuning suggestions on how to improve the performance of under-performing databases and queries
- query and index suggestions are not straight forward. you need to understand sql in order to interpret and use the suggestions properly
- if you have a lot of databases, the price could inhibit the implementation
- not all reported issues have suggested fixes
In order to fully utilize and appreciate SolarWinds Database Performance Analyzer, I do recommend you have some experience with SQL queries and databases, as some of the suggestions and issues that could arise needs to be fully understood prior to implementing the suggested fixes.
SolarWinds Database Performance Analyzer as a whole
- Database Performance Analyzer module helped us capture database response times and other info.
- Database Performance Analyzer is really good at capturing in depth DB data that is not really possible from multiple other modules.
- Investigating everything is manual in SolarWinds Database Performance Analyzer.
- We will need to manually figure out what the issues are using SolarWinds.
SolarWinds DPA review
- Easy to configure
- Real time data
- Notification email templates need improvement
- Needs a little training to go over/work with dashboards
Invaluable, Trusted Performance Diagnostics
- Automated Collection into a queryable repository - Hands-off, detailed collection assures us that the bulk of any performance issues are noted, so that their data can be presented on-demand in a readily consumable form. Drill-into features enable detailed analysis.
- Performance Trend Analysis - Monthly top-consumers visualized in meaningful stacked-charts, with anomaly highlights and per-query, per-day detail enables hot-spot drill-down analysis.
- Resource Utilization Warnings - Best-practice warning and critical measure applied to all facets, visualized in real-time are essential features that trigger troubleshooting.
- Usability within the Trends and Current pages need improvement - Version 11 introduced a new Tuning feature, and changed the way one could quickly name a query and chose whether it would be of further interest, or is more infrastructure-oriented such that exclusion is warranted. Usability took a downward slide.
- Resource Utilization has preset periods which, for longer durations, overly smooth charts. Custom periods are much needed via the UI, rather than repository-querying.
- Storage analysis, similar to resource usage, needs custom periods and far greater ability to delineate between drives and files than v11 currently offers. (One rarely uses the Storage I/O tab)
- Suggest indexes.
- Indicate the wait time for all processes, so you rank the issues and fix them by priority.
- You can send URL/ links to other to show them the exact point of problem. Easy for collaboration.
- Bookmark of problem, so we can revisit the issue and compare it before and after the changes.
- More details on deadlocks/blocking, etc.
- Notification, kind of monitoring, if wait time exceeds some threshold.. or review the wait time of specific bookmarks or issues.
Some queries, which only run very rare, but require a lot of waiting time whenever they do run (all queries that take longer than 60secs).
Best Database Performance Tool
- Track historical performance.
- Isolate the issue by providing a specific area of query impacting performance.
- Can track which user is causing the issue.
- Provides quick indexes where it makes sense.
- Auto tuning - It doesn't have the ability to implement the changes like Oracle Enterprise Manager.
- DPA free version is good but fully functional version should be allowed free for a limited number of instances to give users the ability to try functions without a need to make a purchase.
Small Teams use of DPA
- Quickly identifies slow running queries.
- Identifies which database is causing issues on a server.
- Provides an easy to read way of seeing stats on all servers quickly.
- No way to mark a query activity as normal, for example a slow running SPROC that has to be that way.
- Not many options to restrict access.
SolarWinds DPA review
- Deep queries analyses, provides good advice for performance improvements.
- Allows us to create our own custom alerts and reports.
- Has a very intuitive and well-explained interface. It is split up for different objectives to analyse or monitor as trends, tunning, current activities and resources.
- None identified
DPA: Great web application for wait stats and trends. Not the tool for those needing actionable alerts.
- Capturing wait statistics is a great way to monitor performance on a SQL Server instance. This is the main source of info for DPA.
- Web app: no client install required. Easy to login from a web browser, share info and manage everything from a browser tab.
- Drill-downs from one time interval to seconds to see database activity is intuitive and easy to use.
- Alerts seem to be lacking in DPA compared to competitor's tools. They can be setup but are not quite as easy or as helpful as some other tools I have used.
- Grooming/pruning the repository database isn't very easy. We don't manage a lot of instances but our repo DB has grown pretty significantly.
- At times when I am drilled-down to a chart, it can be difficult to navigate around from that point to another time range/query/metric.

